
Saturday, September 5, 2026

Hyperscalers Deploy 1 Million Custom AI Chips as Alternative to NVIDIA GPUs

Anthropic agreed to use 1 million AWS Trainium2 chips while Google launched its seventh-generation Ironwood TPU. Amazon's Project Rainier data center and strong Q3 earnings from both Alphabet and Amazon signal custom accelerators gaining market share as hyperscalers optimize AI workload economics.

Hyperscalers Deploy 1 Million Custom AI Chips as Alternative to NVIDIA GPUs
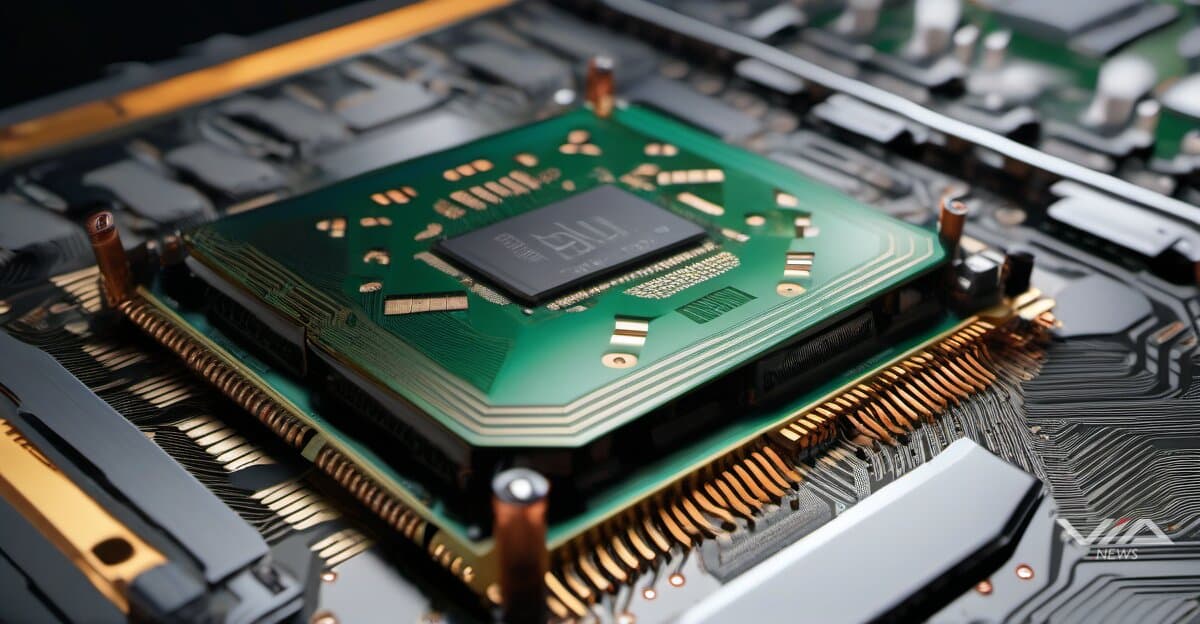
Image generated by AI for illustrative purposes. Not actual footage or photography from the reported events.
Loading stream...

Anthropic committed to deploying 1 million AWS Trainium2 chips in a deal marking the largest custom AI accelerator deployment announced to date. The chips will power Claude AI model training and inference workloads on Amazon's infrastructure.

Google unveiled Ironwood, its seventh-generation TPU, continuing a custom silicon strategy that began in 2016. The company reported strong Q3 2025 earnings partly attributed to AI infrastructure investments. Alphabet's TPU architecture powers Google's Gemini models and cloud AI services.

Amazon revealed Project Rainier, a purpose-built AI data center designed around Trainium chips rather than traditional GPU configurations. The facility represents a shift from retrofitting existing data centers to designing infrastructure optimized for custom accelerators. Amazon's Q3 2025 earnings beat reflected growing AWS AI revenue.

Custom chips offer hyperscalers control over cost-per-inference economics. Training large language models on GPUs costs millions per run. Purpose-built accelerators reduce power consumption and eliminate GPU markup costs. Google reports TPUs deliver better performance-per-watt than comparable GPUs for transformer model training.

NVIDIA dominates AI chip sales with an estimated 90% market share in data center AI accelerators. Custom chips from Amazon, Google, and emerging players like Trainium represent the primary threat to that dominance. Hyperscalers can amortize chip development costs across massive deployments.

The custom accelerator push faces technical barriers. NVIDIA's CUDA software ecosystem took 15 years to mature. Developers familiar with CUDA must learn new frameworks like Amazon's Neuron SDK or Google's XLA compiler. Model portability between cloud providers decreases when training occurs on proprietary chips.

Cost-per-inference metrics will determine whether custom chips capture significant market share in 2026. If Trainium and TPU deployments demonstrate 40-50% cost advantages over GPUs at comparable performance, the economics favor rapid adoption. Early benchmarks suggest custom chips match GPU performance on specific workloads but trail on general-purpose tasks.

In this story

What we know · the intelligence behind this page
Live from the substrate
What we're seeing
AI Capital Surge Meets Investor Caution: Record Funding Rounds and Government Contracts Amid Valuation Skepticism
A single-week cluster of large AI/fintech funding rounds (Socure, Stability AI, Emerald AI, Generalist AI, Instinct, Gatik, Regent Craft) shows venture capital still pouring into AI infrastructure, identity, and autonomy plays, while Palantir's Army TITAN contract win coincided with a 6% stock drop — signaling that even flagship AI-defense revenue isn't immune to market reassessment of AI valuations. Efficiency-focused innovations like Multiverse Computing's model compression suggest the sector is also pivoting toward cost/inference economics as capital intensity draws scrutiny.
Our read on the data ›
Signals we're tracking
EPKINLY Regulatory-Clinical Success Cascade
High probability of expanded label indications, additional combination approvals, and competitive positioning strength in follicular lymphoma market. Predicts positive commercial uptake and potential accelerated review for related indications.
Patterns we're watching ›
Where sources disagree
Morgan Stanley & Co. LLC
The same metric (eps) for the same entity (Morgan Stanley & Co. LLC) reported for the identical fiscal period (Q1 2026) and observation date (2026-03-31) has two conflicting values: 3.43 USD_per_share vs 3.08 USD. This is not a temporal change — both observations claim to measure the same point in time. The ~10% discrepancy (0.35 USD difference) is material for a financial metric.
We flag conflicts openly ›
Recently verified
Checked against the original source
4,981
facts traced to their source — and we flag the ones that don't hold up.
101 entities tracked4,981 facts checked against source5,273 source documents archived
Query this data → isubstrate.com