
Saturday, September 5, 2026

Nvidia Q4 Earnings on February 25 Will Test $2 Trillion AI Hardware Boom

Nvidia reports Q4 2025 earnings on February 25, 2026, as the primary test of whether datacenter GPU demand sustains through early 2026. Broadcom's positive year-to-date stock performance and Microsoft's Azure growth in Q3 2025 signal continued infrastructure spending. Analysts expect revenue guidance to reveal whether cloud providers maintain accelerated AI hardware purchases.

Nvidia Q4 Earnings on February 25 Will Test $2 Trillion AI Hardware Boom
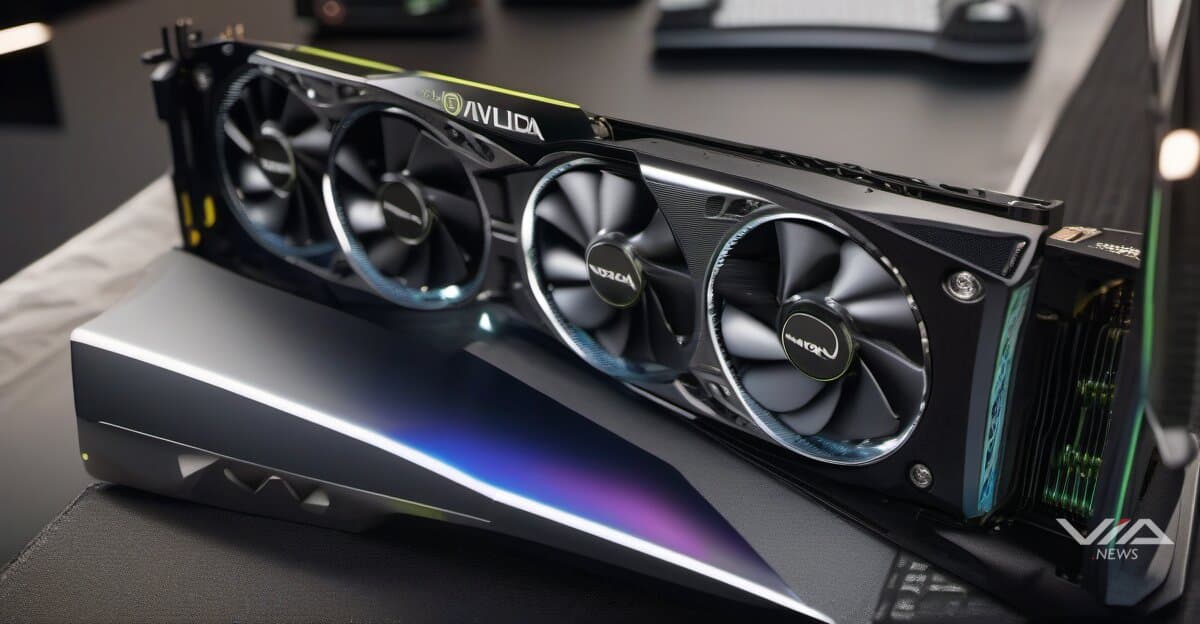
Image generated by AI for illustrative purposes. Not actual footage or photography from the reported events.
Loading stream...

Nvidia reports Q4 2025 earnings on February 25, 2026, providing the first major signal of whether AI hardware demand holds through Q1 2026. The company's datacenter GPU shipments and forward guidance will indicate if hyperscalers sustain the accelerated spending that drove chip stocks higher in 2025.

Broadcom's positive year-to-date stock performance through January 2026 suggests infrastructure demand remains elevated. Microsoft's Azure growth in Q3 2025 (fiscal year 2026 Q1) showed cloud providers expanding capacity. These indicators position Nvidia's earnings as a critical test of whether capital expenditure on AI accelerators continues at 2025 levels.

The GPU market now depends on sustained orders from Microsoft, Amazon, Google, and Meta. These companies drove Nvidia's datacenter revenue to record levels in 2024-2025. Any slowdown in their hardware purchases would signal a shift in AI infrastructure buildout timing.

Intel's Core Ultra Series 3 processors will power over 200 PC designs, expanding AI processing beyond datacenters. Ensurge Micropower develops microbattery technology for AI-enabled edge devices. Both indicate hardware diversification as AI workloads spread from centralized GPUs to endpoint devices.

Analysts will scrutinize three metrics on February 25: datacenter revenue growth rate, Q1 2026 guidance, and GPU allocation to cloud versus enterprise customers. Nvidia's stock trades at valuations that assume continued revenue expansion. Guidance below consensus would pressure semiconductor stocks broadly.

AI accelerator design wins matter beyond Nvidia. AMD competes for datacenter share, while custom chips from Amazon (Trainium), Google (TPU), and Microsoft (Maia) reduce reliance on third-party GPUs. Nvidia's market share trajectory will clarify whether hyperscalers commit to multi-vendor strategies or maintain GPU concentration.

February 25 earnings arrive as AI companies balance infrastructure costs against revenue growth. If Nvidia reports strong demand and raises guidance, it confirms AI hardware spending extends through at least mid-2026. Weak results would suggest the first pause in the GPU boom that began in early 2023.

In this story

What we know · the intelligence behind this page
Live from the substrate
What we're seeing
AI Capital Surge Meets Investor Caution: Record Funding Rounds and Government Contracts Amid Valuation Skepticism
A single-week cluster of large AI/fintech funding rounds (Socure, Stability AI, Emerald AI, Generalist AI, Instinct, Gatik, Regent Craft) shows venture capital still pouring into AI infrastructure, identity, and autonomy plays, while Palantir's Army TITAN contract win coincided with a 6% stock drop — signaling that even flagship AI-defense revenue isn't immune to market reassessment of AI valuations. Efficiency-focused innovations like Multiverse Computing's model compression suggest the sector is also pivoting toward cost/inference economics as capital intensity draws scrutiny.
Our read on the data ›
Signals we're tracking
EPKINLY Regulatory-Clinical Success Cascade
High probability of expanded label indications, additional combination approvals, and competitive positioning strength in follicular lymphoma market. Predicts positive commercial uptake and potential accelerated review for related indications.
Patterns we're watching ›
Where sources disagree
Morgan Stanley & Co. LLC
The same metric (eps) for the same entity (Morgan Stanley & Co. LLC) reported for the identical fiscal period (Q1 2026) and observation date (2026-03-31) has two conflicting values: 3.43 USD_per_share vs 3.08 USD. This is not a temporal change — both observations claim to measure the same point in time. The ~10% discrepancy (0.35 USD difference) is material for a financial metric.
We flag conflicts openly ›
Recently verified
Checked against the original source
4,981
facts traced to their source — and we flag the ones that don't hold up.
101 entities tracked4,981 facts checked against source5,273 source documents archived
Query this data → isubstrate.com