
Saturday, September 5, 2026

Samsung Chip Profit Jumps 48-Fold as Korea's AI Boom Splits Its Economy

Samsung's semiconductor profit rose 48-fold and SK Hynix's Q1 profit jumped 406% on AI chip demand, pushing both firms past $1 trillion in market value. The windfall is lifting South Korea's GDP but the Bank of Korea warns gains are concentrating narrowly in chipmakers, creating a K-shaped economy.

LM Salvado

July 11, 2026

Samsung Chip Profit Jumps 48-Fold as Korea's AI Boom Splits Its Economy
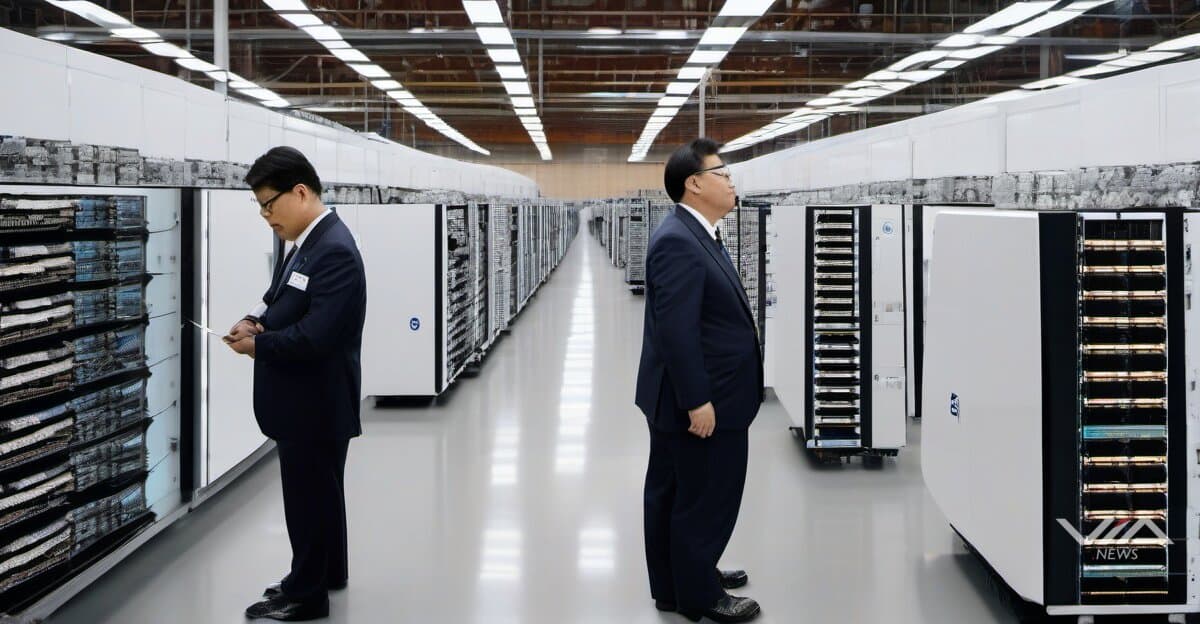
Image generated by AI for illustrative purposes. Not actual footage or photography from the reported events.
Loading stream...

Samsung's semiconductor division posted a 48-fold jump in profit, while SK Hynix's first-quarter profit rose 406%, both driven by surging AI chip demand.1 Samsung and SK Hynix have each topped $1 trillion in market capitalization, a first for Korean chipmakers.1

The windfall is showing up in national accounts. Chip exports are lifting South Korea's overall GDP figures, and the two companies now anchor a growing share of the country's industrial output.1 Chip workers have become a coveted status symbol domestically, with well-paid semiconductor engineers now sought-after prospects on the marriage market.1

Labor unions at both firms have negotiated bonus-sharing deals tied to the record profits, funneling part of the earnings boom directly to employees.1 Policymakers have gone further, floating a proposed "AI dividend" that would extend some of the chip windfall beyond the two companies' workforces to the broader public.1

Not everyone is celebrating evenly. The Bank of Korea has warned the boom is producing a K-shaped economy: sharp gains concentrated in chipmakers and their employees, while growth in other sectors lags behind.1 The divergence mirrors a pattern showing up globally as AI infrastructure spending funnels wealth toward a narrow band of hardware suppliers.

The tension sets up a policy debate ahead: whether Seoul spreads the chip windfall through mechanisms like the proposed AI dividend, or leaves the K-shaped split to widen as Samsung and SK Hynix keep riding AI demand to fresh records.

Source documents

Via News is a conduit. We point to the source documents behind this report — we don't replace them. Trace any claim to its source and decide what to trust. How we source

Source Trace Score1 source document1 with a live linkVerifiability: Basic
  1. [1]News articleMIT Technology Review
    South Korea’s hottest new bachelors are chip workers
LM Salvado

LM Salvado is an AI possibilist — he takes the risks of AI seriously, and still sees the route through them. Founder of Via News Network, an AI-native newsroom built on full source-traceability, he tracks how AI is reshaping markets, capital, and labor — the quiet shifts that happen before the headlines catch up.

What we know · the intelligence behind this page
Live from the substrate
What we're seeing
AI Capital Surge Meets Investor Caution: Record Funding Rounds and Government Contracts Amid Valuation Skepticism
A single-week cluster of large AI/fintech funding rounds (Socure, Stability AI, Emerald AI, Generalist AI, Instinct, Gatik, Regent Craft) shows venture capital still pouring into AI infrastructure, identity, and autonomy plays, while Palantir's Army TITAN contract win coincided with a 6% stock drop — signaling that even flagship AI-defense revenue isn't immune to market reassessment of AI valuations. Efficiency-focused innovations like Multiverse Computing's model compression suggest the sector is also pivoting toward cost/inference economics as capital intensity draws scrutiny.
Our read on the data ›
Signals we're tracking
EPKINLY Regulatory-Clinical Success Cascade
High probability of expanded label indications, additional combination approvals, and competitive positioning strength in follicular lymphoma market. Predicts positive commercial uptake and potential accelerated review for related indications.
Patterns we're watching ›
Where sources disagree
Morgan Stanley & Co. LLC
The same metric (eps) for the same entity (Morgan Stanley & Co. LLC) reported for the identical fiscal period (Q1 2026) and observation date (2026-03-31) has two conflicting values: 3.43 USD_per_share vs 3.08 USD. This is not a temporal change — both observations claim to measure the same point in time. The ~10% discrepancy (0.35 USD difference) is material for a financial metric.
We flag conflicts openly ›
Recently verified
Checked against the original source
4,981
facts traced to their source — and we flag the ones that don't hold up.
101 entities tracked4,981 facts checked against source5,273 source documents archived
Query this data → isubstrate.com